Monitoring as a part of software observability is crucial for understanding the state and health of the system. Video analytical and computer vision pipelines also benefit from monitoring, allowing SRE engineers to understand and predict system operation and reason about problems based on anomalies and deviations.
Computer vision pipelines represent complex software working in a wild environment, requiring continuous observation to understand trends and correlations between internal and external factors.
To solve that problem, we integrated Prometheus metric exporter in Savant. The exporter allows for exporting two kinds of metrics:
- System metrics collected from Savant components;
- User-defined metrics collected from Python functions.
Observability in Savant
Savant supports not only metrics but also OpenTelemetry traces allowing to trace every frame passing through the pipeline. Traces help to instrument the system very precisily which is not requried for monitoring needs because it requires a lot of effort to transform tracing data into metrics.
To overcome the situation we implemented metrics showing aggregate performance counters and gauges for a running pipeline.
Currently, metrics are exported in the Prometheus format. However, we intend to modify the exported to support OpenTelemetry when Prometheus supports it (expected to be in the 3.0 release).
System Metrics
They are collected internally for every pipeline stage, including those not managed by the user. Every stage counts the number of processed frames, batches, their metadata objects, and the current queue length. Those metrics are automatically exported to Prometheus when the telemetry.metrics section is configured.
params:
  telemetry:
    metrics:
      # Output stats after every N frames
      frame_period: ${oc.decode:${oc.env:METRICS_FRAME_PERIOD, 10000}}
      # Output stats after every N seconds
      time_period: ${oc.decode:${oc.env:METRICS_TIME_PERIOD, null}}
      # How many last stats to keep in the memory
      history: ${oc.decode:${oc.env:METRICS_HISTORY, 100}}
      # Metrics provider name
      provider: ${oc.decode:${oc.env:METRICS_PROVIDER, null}}
      # Parameters for metrics provider
      provider_params: ${json:${oc.env:METRICS_PROVIDER_PARAMS, null}}
Currently, the only supported provider is Prometheus. The params.telemetry.metrics.provider_params allows setting port and labels attributes:
params:
  telemetry:
    metrics:
      frame_period: 1000
      time_period: 1
      history: 100
      provider: prometheus
      provider_params:
        port: 8000
        labels:
          module_type: detector
The port defines the endpoint for the Prometheus collector to connect to. The labels allow custom labels to be set for all gauges and counters.
User-defined Metrics
As well as system-level metrics, Savant allows developers to collect their own metrics in pyfuncs. We support only two kinds of them: a counter and a gauge. Developers can use the following syntax to implement the functionality:
"""Example of how to use metrics in PyFunc."""
from savant.deepstream.meta.frame import NvDsFrameMeta
from savant.deepstream.pyfunc import NvDsPyFuncPlugin
from savant.gstreamer import Gst
from savant.metrics import Counter, Gauge


class PyFuncMetricsExample(NvDsPyFuncPlugin):
    """Example of how to use metrics in PyFunc.

    Metrics values example:

    .. code-block:: text

        # HELP frames_per_source_total Number of processed frames per source
        # TYPE frames_per_source_total counter
        frames_per_source_total{module_stage="tracker",source_id="city-traffic"} 748.0 1700803467794
        # HELP total_queue_length The total queue length for the pipeline
        # TYPE total_queue_length gauge
        total_queue_length{module_stage="tracker",source_id="city-traffic"} 36.0 1700803467794

    Note: the "module_stage" label is configured in docker-compose file and added to all metrics.
    """

    # Called when the new source is added
    def on_source_add(self, source_id: str):
        # Check if the metric is not registered yet
        if 'frames_per_source' not in self.metrics:
            # Register the counter metric
            self.metrics['frames_per_source'] = Counter(
                name='frames_per_source',
                description='Number of processed frames per source',
                # Labels are optional, by default there are no labels
                labelnames=('source_id',),
            )
            self.logger.info('Registered metric: %s', 'frames_per_source')
        if 'total_queue_length' not in self.metrics:
            # Register the gauge metric
            self.metrics['total_queue_length'] = Gauge(
                name='total_queue_length',
                description='The total queue length for the pipeline',
                # There are no labels for this metric
            )
            self.logger.info('Registered metric: %s', 'total_queue_length')

    def process_frame(self, buffer: Gst.Buffer, frame_meta: NvDsFrameMeta):
        # Count the frame for this source
        self.metrics['frames_per_source'].inc(
            # 1,  # Default increment value
            # Labels should be a tuple and must match the labelnames
            labels=(frame_meta.source_id,),
        )
        try:
            last_runtime_metric = self.get_runtime_metrics(1)[0]
            queue_length = sum(
                stage.queue_length for stage in last_runtime_metric.stage_stats
            )
        except IndexError:
            queue_length = 0

        # Set the total queue length for this source
        self.metrics['total_queue_length'].set(
            queue_length,  # The new gauge value
            # There are no labels for this metric
        )
The metric exporter exports current metric values according to its schedule, not every set value.
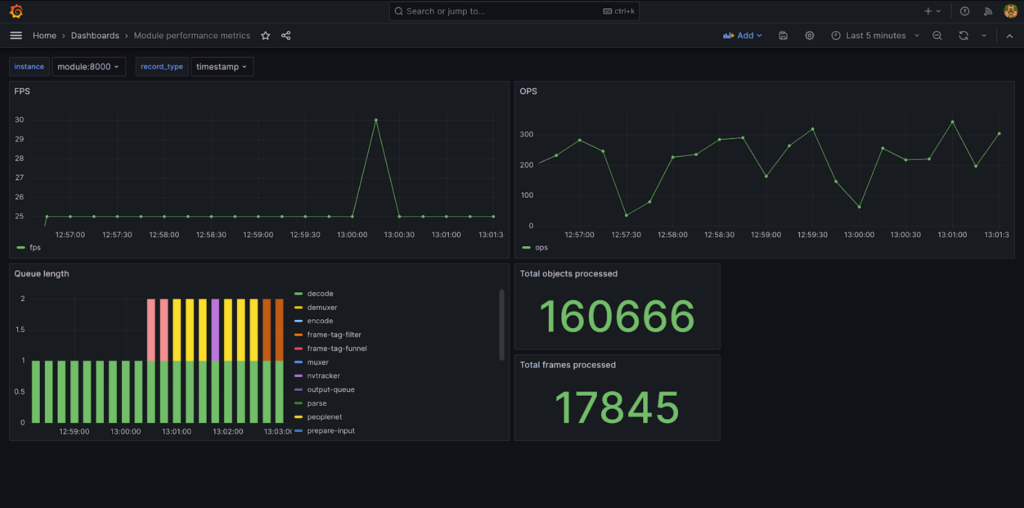
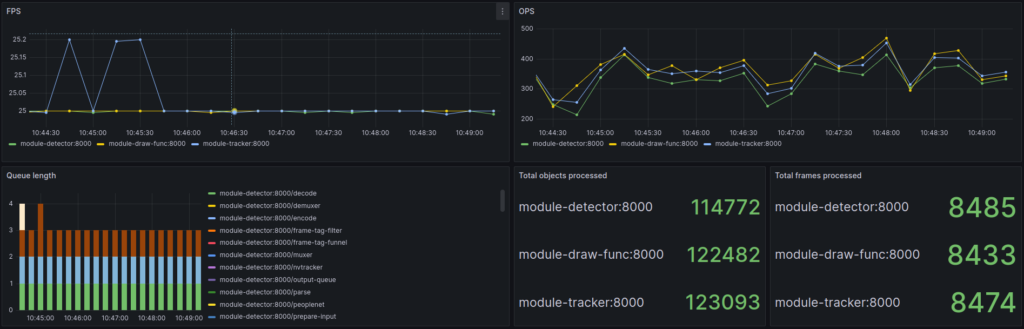
End-To-End Sample
We have created a complete demonstration showing how to use metrics. You can find it in the Savant repo by the following link. The sample provides a ready-to-use Grafana dashboard displaying all system metrics.
Links
Interested in diving deeper into observability? Investigate how OpenTelemetry traces can be used in Savant for development and precise instrumenting.
Don’t forget to subscribe to our X to receive updates on Savant. Also, we have Discord, where we help users.
To know more about Savant, read our article: Ten reasons to consider Savant for your computer vision project.