The pipeline calculates vehicles passing from a source edge to a destination edge and sends statistics to Grafana for visualization. The user configures a per-cam traffic metering zone with a polygonal area and labels its lines with assigned tags for metering traffic passing through them.
The Demo Page On GitHub: https://github.com/insight-platform/Savant/tree/develop/samples/intersection_traffic_meter
About
This pipeline extends the previously presented traffic_meter pipeline: before, the user-specified two lines with just entry and exit labels. The current pipeline is more generic. However, the old one is not deprecated: there are tasks that ideally fit into the older registering model, like speed metering or counting on roads without branches. In a road analytics system, both approaches can be combined to reach better performance with less required compute resources.
Also, the old demo shows the use of other concepts of Savant, allowing one to choose the model from YOLOV8M, YOLOV8N, and PeopleNet. On the other hand, the current solution relies on YOLOV8M; however, the interested user can replace it with another model.
The new demo on YouTube:
The old one:
With the old solution you also can find out the metering for people:
How The End-To-End Solution Works
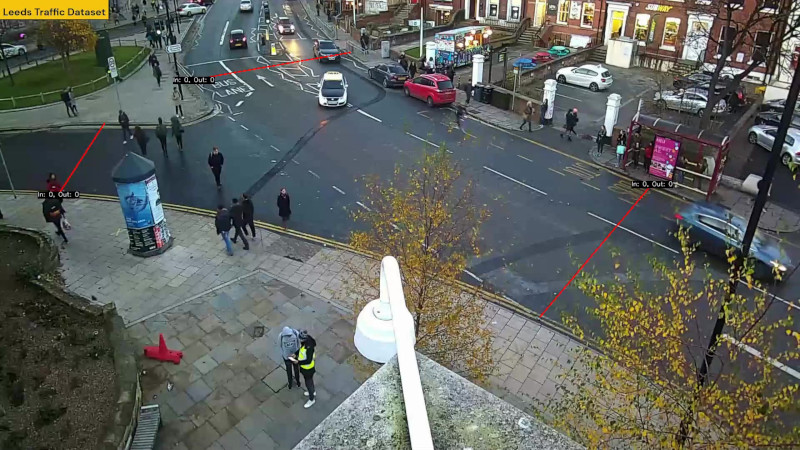
The solution is based on a stock-trained YOLOV8M for detecting vehicles. The detected objects are tracked with the NvDCF tracker. Every stream, configured for the processing, has an assigned polygonal area, specified in the YAML configuration file:
# The id of the video source that sends the intersection video
leeds:
  # The points define a polygon in the frame that delimits the intersection
  points:
    - [140, 465]
    - [250, 295]
    - [465, 190]
    - [840, 125]
    - [1565, 440]
    - [1295, 760]

  # Edges list contain the string tags for the polygon edges.
  # The 1st list element is the edge between the 1st and the 2nd points from the list above,
  # the 2nd is the edge between the 2nd and 3rd points and so on.
  # If the edge tag is null, then it is disabled:
  # the edge is not drawn on the frame and the crossings are not checked for it.
  # Do not use "->" or "+" in the edge tags
  # as these strings serve as separators for dynamically generated crossing direction names
  edges:
    - left
    - null
    - top
    - null
    - bottom
    - null
The edges marked with a non-null value are used to count traffic and are displayed on video.
When the track crosses an edge with an assigned label it is registered and counted. Tracks crossing two edges are sent to the Graphite database, from where they are visualized with Grafana.

Why Grapite?
Graphite allows for UDP metric ingestion which is beneficial for a real-time system: in the worst case metrics can be lost, but the pipeline will not block.
The sample includes the end-to-end solution based on Docker Compose using a synthetic data source and can be easily deployed to production by replacing the data source with a real-life RTSP stream.
Performance
Edge. The pipeline can work in real-time on the previous generation Jetson NX (20+ FPS) and on all modern Orin Family devices.
Data Center. 4-5 cams on a single RTX4000 GPU (roughly equal to T4, A10, RTX A4000).
Replacing YOLOV8M with YOLOV8N can significantly improve the performance, if the scene fits it.
If you are interested in getting to know more about the previous solution explained in detail, visit the article on Medium.
Please, Visit our Discord server to learn more and discuss Savant. Consider giving us 🌠 on GitHub: it makes our developers happy and helps Savant become more visible.