OpenTelemetry is the industry standard for code instrumenting widely used in modern complex applications. It shines bright in distributed, multithreaded, and asynchronous systems. With OpenTelemetry, developers can trace, log, and collect metrics.
Traces are fantastic inventions that allow us to combine code tracing, events, and custom attributes in a single hierarchical structure of spans. Every trace relates to a single business transaction served by a system. What is great about traces is that they can propagate between systems, tying their behaviors together as a whole. That is why OpenTelemetry is especially popular in microservices systems.

However, not only such systems benefit from tracing. In the article, we present OpenTelemetry integration in Savant. Let us explain why it is necessary and how it can be used.
Distributed Video Analytics
Savant allows building of distributed CV/ML applications spanning the processing from edge to core with intermediary networks, queues, and storage. The topology of such pipelines is either a linear chain or a directed graph; in both scenarios, we need to know how the video frame passes the distributed pipeline, where it is stuck or gets lost, and when the pipeline is limited in capacity. The propagation feature helps us view the whole picture, showing the pipeline’s performance and helping us troubleshoot it if necessary.
High-Performance Video Analytics
Developers want their pipelines to work fast, meeting the strict business requirements related to efficient use of hardware resources. Thus, the developers need to know the profile of their code, showing how long it takes to execute certain pieces. OpenTelemetry provides great tooling for it: a developer can wrap the code in a hierarchy of spans to observe which code parts require attention:

- Custom attributes. Every high-level processing block is wrapped in a system span context. The developer can attach an attribute to the span.
- Events. When a log message is produced, it is also tied with the span, in this case, with the system span.
- Hierarchy. Developers can create a nested span to profile certain pieces of code.
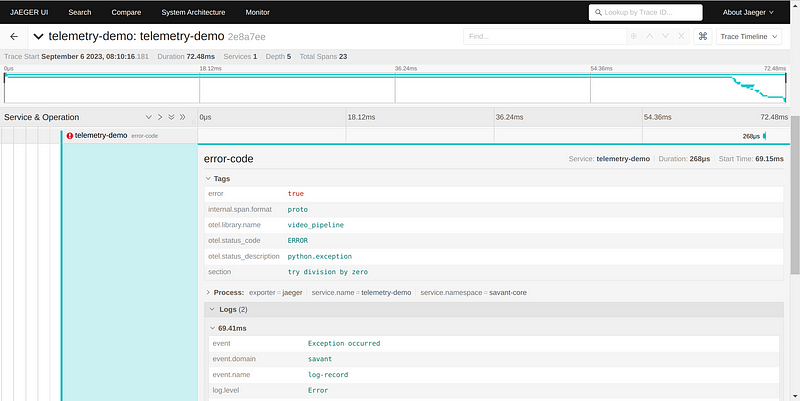
- Exception capturing. When an exception happens in the span, the span receives exception information and continues passing the control to an outer structure.
In the tracing system, the above-listed code produces the following artifacts:


Log Analysis
Video analytics systems represent the class of mass-parallel systems, handling multiple frames at once in multiple steps of the pipeline. Such a behavior is often can be met in multithreaded or asynchronous systems. Those who did log analysis in such systems know it is a pain. The log records are related to a single transaction shuffle with logs produced by other transactions, so finding the beginning and end of the operation is a headache. OpenTelemetry solves it by assigning a unique Trace ID to every transaction passing through the system.

You no longer need to cry on logs: find the required Trace ID, go to the trace analytics system like Jaeger, and explore it without the distraction. You may build your analytics on top of the existing trace analytics system covering the cases specific to your system.
How To Start Using OpenTelemetry In Savant
Explore the sample demonstrating the use of OpenTelemetry in Savant. Along with the demo, you can find other samples covering how to use various models and build pipelines with Savant:
https://github.com/insight-platform/Savant/tree/develop/samples
Consider visiting our GitHub, and don’t forget to subscribe to our X to receive updates on Savant. Also, we have Discord, where we help users to onboard.